Table of Contents
- Why Impurities in Research Peptides Matter More Than the Purity Number
- Synthetic Peptide Impurities: How the Synthesis Process Creates Them
- Peptide Degradation Products: What Happens After the Vial Is Sealed
- Peptide Purity Testing: What Analytical Methods Actually Measure
- Reading a Peptide Certificate of Analysis Without Getting Fooled
- Research-Grade Peptides vs. Pharmaceutical-Grade Medicines
- Storage, Handling, and Impurity Formation Over Time
- A Structured Impurity Identification Workflow
- Frequently Asked Questions
Last Updated: October 15, 2026
Why Impurities in Research Peptides Matter More Than the Purity Number
A vial labeled “99% pure” still contains roughly one part in a hundred that is something else, which is why common impurities in research peptides deserve more attention than the headline purity figure. Peptide-related impurities are the unwanted molecules alongside the target sequence: deleted, truncated, or extended chains, partially deprotected fragments, and chemical breakdown products that accumulate during storage.
At PepAlphatides, every batch goes through independent third-party testing because a purity number without context says little about those residual components. This guide covers where impurities come from, how analytical methods detect them, how to read a peptide certificate of analysis without being misled by one percentage, and a practical identification workflow to apply before running an assay.
Synthetic Peptide Impurities: How the Synthesis Process Creates Them
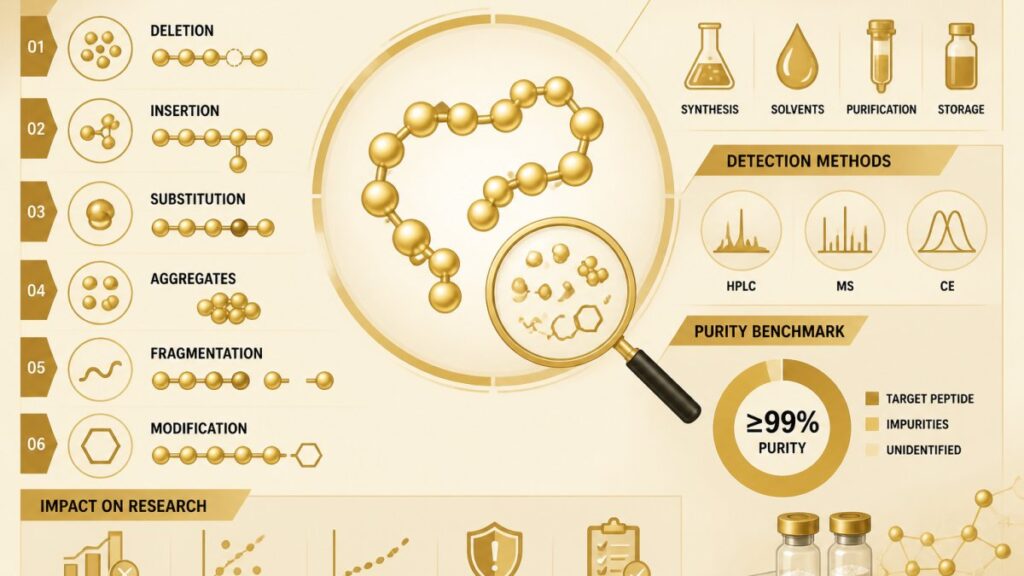
Synthetic peptide impurities are by-products of solid-phase synthesis, not contaminants introduced afterward. The process builds a chain one amino acid at a time through repeated coupling and deprotection cycles, and each cycle is a chance for a side reaction. Longer sequences mean more cycles and more opportunities for a permanent mark, with most process-related impurities tracing back to a specific stage of the build.
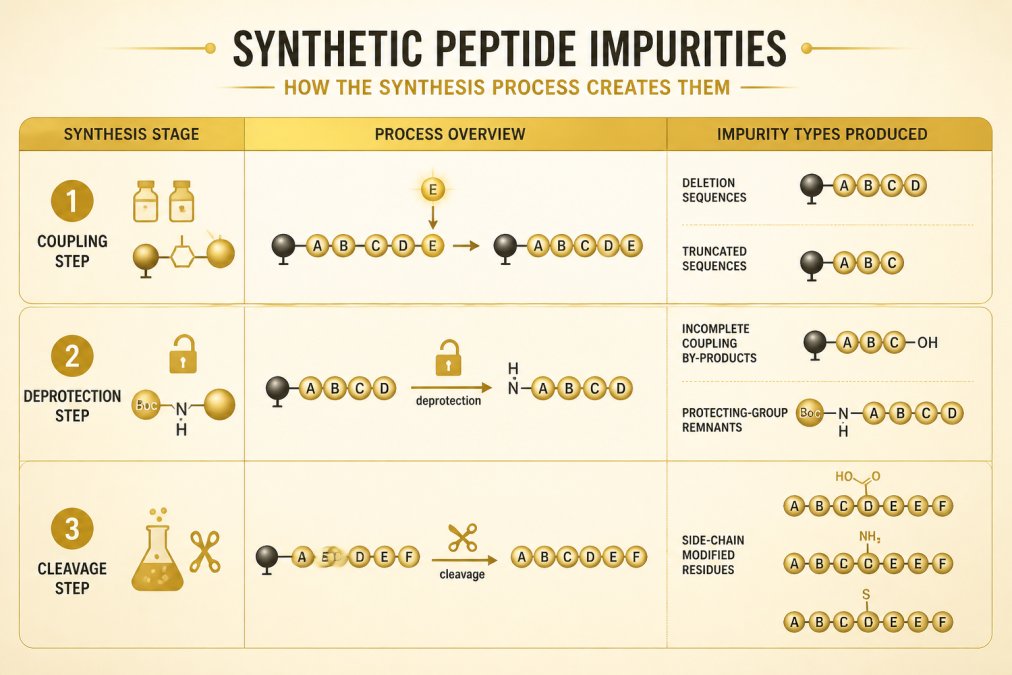
Deletion and Truncated Sequences
A deletion sequence is missing one or more internal amino acids; a truncated sequence stopped early. Both arise when a coupling step fails to add the intended residue and the chain keeps building without it, producing a molecule similar to the target but with a different mass, which is why mass spectrometry catches these reliably. Deletion peptides are among the most common product-related impurities in longer sequences and can be hard to separate during purification because their physical properties overlap.
Incomplete Coupling and Deprotection By-Products
Incomplete coupling leaves a fraction of chains without the new residue, producing a deletion. Incomplete deprotection leaves protecting groups attached, blocking the next coupling and creating a stalled fragment. Both are process-related impurities tied to reaction efficiency, and a high overall purity number does not rule them out, it only means they are present at a low combined level.
When you review a certificate of analysis, look for a chromatogram rather than only the purity percentage. A single sharp main peak with minimal shoulders tells you more about synthesis quality than the headline number alone.
Epimerization and Stereoisomers
Epimerization converts an L-amino acid into its D-form during chain assembly, producing stereoisomers that share the target’s mass but differ in shape. Because the molecular weight is identical, standard mass spectrometry cannot distinguish them, and chromatography often cannot either. A sample can therefore read as highly pure while containing an epimerized fraction that behaves differently in a biological assay.
Peptide Degradation Products: What Happens After the Vial Is Sealed
Peptide degradation products form after synthesis, during storage and handling, and are distinct from synthesis by-products. A peptide that leaves the lab clean can still degrade over months depending on temperature, moisture, and how often the vial is opened, which is why storage discipline matters as much as manufacturing quality.
Oxidation, Deamidation, and Other Degradation Pathways
Oxidation attacks susceptible residues such as methionine and tryptophan, adding oxygen and shifting mass. Deamidation converts asparagine or glutamine into acidic residues, accelerated by heat and neutral-to-basic pH. Other pathways also contribute to the impurity profile over time:
- Aspartimide and succinimide formation, which can rearrange into isoaspartate
- Diketopiperazine formation, typically at the chain terminus
- Pyroglutamate formation, common at an N-terminal glutamine
- β-elimination and other side-chain reactions on modified residues
Reconstituting a peptide and then storing it for weeks at room temperature accelerates deamidation and oxidation. If you plan to use a solution across multiple sessions, aliquot and freeze it rather than repeatedly warming one vial.
Peptide Purity Testing: What Analytical Methods Actually Measure
Peptide purity testing measures how much of a sample elutes as the target peak under one specific set of conditions, a narrower claim than most people assume, and the gap between what a method reports and what is in the vial is where misinterpretation happens.
How RP-HPLC Produces a Purity Number
Reversed-phase high-performance liquid chromatography (RP-HPLC) is the workhorse method. The sample is injected onto a column packed with a hydrophobic stationary phase, typically C18 or C8 silica, and components separate by how strongly they partition between the mobile and stationary phases as organic content increases. Detection is usually by ultraviolet absorbance at 214 nm, where the peptide backbone amide bond absorbs strongly.
The purity figure is calculated as the area of the main peak divided by the total area of all integrated peaks, expressed as a percentage. Three details in that sentence matter more than the number itself:
- Area, not mass. UV absorbance depends on the chromophores present. A peptide with more aromatic residues (tryptophan, tyrosine, phenylalanine) absorbs more per mole than one without them, so peak area is a proxy for concentration, not an exact measure of it.
- Integrated peaks, not all species. Anything that does not absorb at the detection wavelength, or that never elutes from the column, is invisible to the calculation.
- One set of conditions. Change the column, gradient, mobile phase, or wavelength and the same sample can report a different purity.
Why Co-Elution and Response Factors Distort the Number
Two peptides with similar hydrophobicity can elute at nearly the same retention time, merging into a single peak that the integration software counts as one species. A deletion peptide missing one hydrophobic residue, or an epimerized form of the target, is a common co-eluter because the structural change is too small for the column to resolve under standard gradient conditions.
Response factors compound the problem: an impurity that absorbs more strongly than the target at the detection wavelength has its contribution to total peak area overstated relative to its molar abundance, and one that absorbs less is understated. Neither case is visible from the chromatogram alone.
Detection Limits and the “Missing” Impurity
Every detector has a limit of detection and a limit of quantification, and impurities below those thresholds do not appear as peaks at all. A sample reported at 99% purity is not a sample with 1% impurity; it is one whose resolved, UV-active impurities sum to roughly 1% of total peak area under those conditions. Trace, non-UV-active, and column-retained species can all be present without showing up.
What Mass Spectrometry Adds, and What It Does Not
Mass spectrometry (MS) confirms molecular identity by measuring the mass-to-charge ratio of peptide ions against the expected molecular weight. It is essential for confirming the main peak is the intended sequence, but it is not a purity method in the chromatographic sense and does not resolve species sharing the same mass, epimers, isoaspartate versus aspartate, and other isomers with identical formulas are indistinguishable by mass alone.
Orthogonal Methods and When to Reach for Them
Because no single method captures everything, laboratories use orthogonal techniques when the question demands it:
- Capillary electrophoresis (CE) separates by charge-to-size ratio rather than hydrophobicity, so it can resolve species that co-elute on RP-HPLC.
- Ion-exchange chromatography separates by net charge and is useful for detecting deamidated or otherwise charge-altered variants.
- LC-MS/MS peptide mapping digests the peptide and analyzes fragments, which can localize where a modification occurred rather than only confirming that one exists.
- Amino acid analysis (AAA) quantifies the molar ratio of residues and can flag a deletion that chromatography missed.
When a certificate reports purity by RP-HPLC only, ask whether an orthogonal method was used for identity confirmation. A single-method report is not wrong, but it is a narrower claim than a multi-method report.
The practical takeaway: a purity percentage is a measurement under defined conditions, not a guarantee of absence. Two samples can both read 98% while containing entirely different impurity populations, because the number only reflects what the chosen method can resolve.
Reading a Peptide Certificate of Analysis Without Getting Fooled
A certificate of analysis (COA) is only as useful as the detail behind it. It should state the analytical method, column and detection wavelength, retention time, and purity figure, plus a batch or lot number tying the report to the specific vial in your hand. Without that link, the certificate describes some batch, not necessarily yours.
The deeper skill is knowing what each COA element establishes, and what it does not. A COA is evidence, not a verdict, and the difference matters when deciding whether a material is fit for a specific experiment.
What Each COA Element Does and Does Not Establish
| COA Element | What It Establishes | What It Does Not Establish |
|---|---|---|
| Batch/lot number | The report corresponds to a defined manufacturing lot | That the vial in your hand came from that lot, unless the vial label matches |
| Purity percentage | The proportion of total integrated peak area attributable to the main peak under the stated method | That the remaining area is the only impurity present, or that the main peak is the target sequence |
| Chromatogram | Peak shape, retention time, and the presence of resolved shoulders or secondary peaks | That co-eluting or non-UV-active species are absent |
| Mass confirmation | The main peak has the expected molecular weight | That isomers, epimers, or same-mass variants are absent |
| Testing laboratory | Who performed the analysis and under what conditions | That the method used is appropriate for your intended application |
| Sterility or endotoxin (if listed) | The specific test result for the specific sample tested | That the material is suitable for human use |
The Purity Percentage Trap
A headline figure of 99% is the most quoted number on any COA and the least informative on its own. It tells you that under one set of chromatographic conditions, 99% of the UV-active, resolved material eluted as a single peak, nothing more:
- Whether that peak is the correct sequence (identity is a separate test)
- Whether the 1% residual contains one impurity or a dozen
- Whether any of those impurities are the ones that matter for your assay
- Whether the method could have detected the impurities you care about
A COA that reports 99% purity by RP-HPLC and confirms identity by mass spectrometry is a reasonable baseline. A COA that reports 99% purity with no chromatogram, no method detail, and no mass confirmation is a number without evidence.
Reading a Chromatogram Like an Analyst
When a chromatogram is included, look at the shape of the main peak before the percentage. A symmetric, sharp peak with a flat baseline suggests clean separation; a leading shoulder, trailing tail, or cluster of small peaks nearby suggests the method is resolving something the percentage alone does not convey. The retention time should match the method description, a mismatch signals the report and method may not correspond.
Questions Worth Asking Before You Buy
A supplier’s willingness to answer these questions is itself a data point:
- What method was used for purity, and at what wavelength was detection performed?
- Was identity confirmed by mass spectrometry, and is the spectrum available?
- Is the testing performed in-house or by an independent laboratory?
- Can the batch documentation be verified against the specific lot number on the vial?
- Are raw data files available on request, or only the summary report?
PepAlphatides attaches a secure QR code to each vial so the batch documentation can be verified against the specific lot. If a supplier will not show you a full certificate before purchase, treat that as a signal about how much transparency you can expect afterward.
A COA is a record of testing performed on a sample. It is not a certification that the material is safe, effective, or appropriate for any particular use. Research-grade materials are not evaluated for human use, and a COA does not change that.
Impurity-Specific Diagnostic Clues
When a COA or an in-house chromatogram shows an unexpected peak, matching the observation to a likely cause speeds up troubleshooting. The table below links common analytical clues to probable origins.
| Analytical Clue | Likely Cause | Chemical Change | Potential Mitigation |
|---|---|---|---|
| Mass shift of +16 Da | Oxidation | Methionine or tryptophan side chain gains oxygen | Store under inert gas, limit light and oxygen exposure |
| Mass shift of +1 Da | Deamidation | Asparagine or glutamine converted to acidic residue | Control pH and temperature, avoid prolonged storage in solution |
| Mass shift of −18 Da | Dehydration or aspartimide formation | Loss of water, often at aspartate or asparagine | Minimize exposure to acidic or basic extremes |
| Mass shift of −17 Da | Pyroglutamate formation | N-terminal glutamine cyclizes, releasing ammonia | Common in N-terminal Gln sequences; consider sequence design |
| Mass shift of −(residue mass) | Deletion sequence | One amino acid omitted during coupling | Review synthesis cycle efficiency; longer sequences more prone |
| Mass shift of +(residue mass) | Insertion or extension | Extra residue added or chain extended | Review coupling and capping steps |
| Same mass, different retention | Epimerization or isoaspartate | Stereochemistry or backbone connectivity changed | Use orthogonal separation; mass alone cannot resolve |
| Late-eluting hydrophobic peak | Protecting-group remnant or truncated fragment | Incomplete deprotection or early chain termination | Review deprotection efficiency and cleavage conditions |
This table is a starting point, not a diagnosis. A mass shift consistent with oxidation could arise from a different modification with the same nominal mass change, so confirmatory analysis, often LC-MS/MS peptide mapping, is needed when an impurity’s identity affects your results.
Research-Grade Peptides vs. Pharmaceutical-Grade Medicines
Research-grade peptides and pharmaceutical-grade medicines are held to different standards, and conflating them causes real confusion. Pharmaceutical-grade material is manufactured under current Good Manufacturing Practice requirements enforced by the U.S. Food and Drug Administration, with validated processes, defined impurity limits, and batch release testing tied to clinical use. Research-grade compounds are sold for laboratory and analytical work, not for human use, and they are not subject to the same release framework.
That distinction matters for how you interpret an impurity profile. A certificate showing 99% purity for a research compound does not mean it meets pharmaceutical specifications, because the two are measured against different criteria. Research-grade material is appropriate for assay development, method validation, and analytical work. It is not interchangeable with a regulated medicine, and reputable suppliers say so plainly.
Storage, Handling, and Impurity Formation Over Time
Storage conditions determine how much a peptide degrades after it reaches you, and the effect compounds over time. Lyophilized powder held at low temperature degrades far more slowly than a reconstituted solution kept warm. Every time a vial is opened and warmed, moisture enters and oxidation and deamidation speed up; freeze-thaw cycles are equally damaging because repeated temperature swings stress the molecule.
Practical handling rules that experienced researchers follow:
- Store lyophilized powder frozen and protected from light until use
- Reconstitute with appropriate solvent only when ready to work
- Aliquot before freezing to avoid repeated freeze-thaw cycles
- Keep working solutions cold and use them within a defined window
- Log the date of reconstitution on the vial itself
None of this prevents degradation entirely. It slows it enough that your measurements reflect the peptide, not its breakdown products.
A Structured Impurity Identification Workflow
A structured workflow turns a vague purity number into an actionable picture of the sample. Confirm identity by mass spectrometry against the expected molecular weight, compare the chromatogram against the target peak to spot shoulders and late-eluting species, and isolate and characterize anything unexpected separately.
- Confirm molecular identity by mass spectrometry
- Inspect the chromatogram for shoulders and secondary peaks
- Estimate relative abundance of each resolved species
- Isolate suspect peaks and characterize them individually
- Match observed mass shifts to known pathways: oxidation, deamidation, deletion
- Document the profile and compare against your acceptance criteria
The key insight is that identification is comparative. A mass shift of roughly 16 units points toward oxidation; a shift near 1 unit suggests deamidation. Building a small reference of expected shifts for your sequences makes the workflow faster each time you run it. For deeper background on analytical method selection, the United States Pharmacopeia publishes reference standards that many laboratories follow.
Purity percentage is a starting point, not a verdict. The impurity profile, the method behind it, and the batch documentation together tell you whether a material is fit for your specific experiment.
The hardest part of working with research peptides is not the assay itself. It is knowing whether the material in front of you is what the label claims, and whether it has held up since it was sealed. PepAlphatides addresses that directly with purity levels exceeding 99% verified by independent third-party laboratories, an individual Certificate of Analysis for every product, and secure QR codes on each vial so you can trace your batch back to its testing records. Research members also receive a 10% discount, and orders over $250 ship free. Get started with PepAlphatides and run your next experiment on material you can actually document.
Frequently Asked Questions
What are the three types of impurities found in research peptides?
Impurities in research peptides generally fall into three groups: process-related impurities from synthesis (deletion sequences, truncated sequences, incomplete coupling by-products, protecting-group remnants), product-related impurities (modified residues, epimerized stereoisomers), and degradation products that form during storage (oxidation, deamidation, pyroglutamate formation). A certificate of analysis typically reports the overall purity figure, but it may not break down which category each impurity belongs to. Understanding the categories helps you judge whether a purity number reflects synthesis quality, storage conditions, or both.
Is 98% purity good enough for research peptides?
A 98% purity figure means roughly 2% of the material is something other than the target peptide, which can include deletion sequences, truncated fragments, or degradation products. Whether that is acceptable depends on your experiment. Assays sensitive to structural analogs may need higher purity, while less sensitive work may tolerate more. Purity testing methods also have limits: reversed-phase chromatography separates components by hydrophobicity, so impurities with similar retention times can co-elute and go uncounted. Treat the percentage as one data point, not a guarantee.
Does a high purity percentage guarantee a peptide is free of contaminants?
No. Purity percentages come from analytical methods with defined limits. Two peptides that both report 99% purity can differ in which impurities remain. Residual solvents, counterions, and water content are usually measured separately from the main purity figure. A certificate of analysis that reports only a single purity number, without method details or additional tests, gives you less information than one that documents the analytical method, the detection wavelength, and any secondary testing.
What should I look for in a peptide certificate of analysis?
A useful certificate of analysis identifies the batch, states the analytical method used (commonly HPLC and mass spectrometry), shows the purity result with the detection wavelength, and includes a mass spectrometry confirmation of molecular weight. Look for a testing date, a lot or batch number that matches your vial, and whether testing was done by an independent third-party laboratory. If the document cannot be tied to your specific batch, or if the method is not stated, the purity claim is harder to verify.