Table of Contents
- What Peptide Purity Actually Means
- Why Purity Directly Affects Your Experimental Outcomes
- How Impurities and Truncated Sequences Influence Biological Activity
- HPLC Peptide Purity: How the Gold Standard Measurement Works
- Mass Spectrometry Peptide Identity: Confirming You Have the Right Compound
- How to Read a Peptide COA and What the Numbers Tell You
- Acceptable Peptide Purity for Research: What Level Do You Actually Need?
- Purity Versus Identity, Concentration, and Biological Activity
- Batch-to-Batch Consistency and Reproducibility in Your Research
- Frequently Asked Questions
Last Updated: October 17, 2026
What Peptide Purity Actually Means
Peptide purity refers to the percentage of your sample that is the correct, intended peptide compound versus unwanted substances. A 98% pure peptide means 98% of the material is your target peptide and 2% is impurities, byproducts, or other compounds.
Purity directly shapes your experiments, but it doesn’t tell the complete story: it doesn’t confirm identity, measure concentration, or predict biological activity. Those are separate measurements that work alongside purity.
At PepAlphatides, we recognize that researchers need clarity on what these numbers represent. Understanding why peptide purity matters for experiments separates reliable results from problematic ones.
Here’s what makes up that remaining percentage:
- Truncated sequences, peptides missing one or more amino acids from the intended chain
- Deletion sequences, similar to truncated, but with gaps in the middle of the sequence
- Side products, compounds created during synthesis but not your target peptide
- Residual solvents, traces of chemicals used during purification
- Counterions, salt molecules or other charged compounds from the synthesis process
Each of these impurities behaves differently in your assay. Some are inert. Others interfere with binding, skew your data, or trigger unexpected biological responses.
The purity percentage on a certificate of analysis reflects what analytical testing detected at that moment. It’s a snapshot, not a guarantee of stability over time. Store your peptides correctly to maintain purity throughout your research timeline.
Why Purity Directly Affects Your Experimental Outcomes
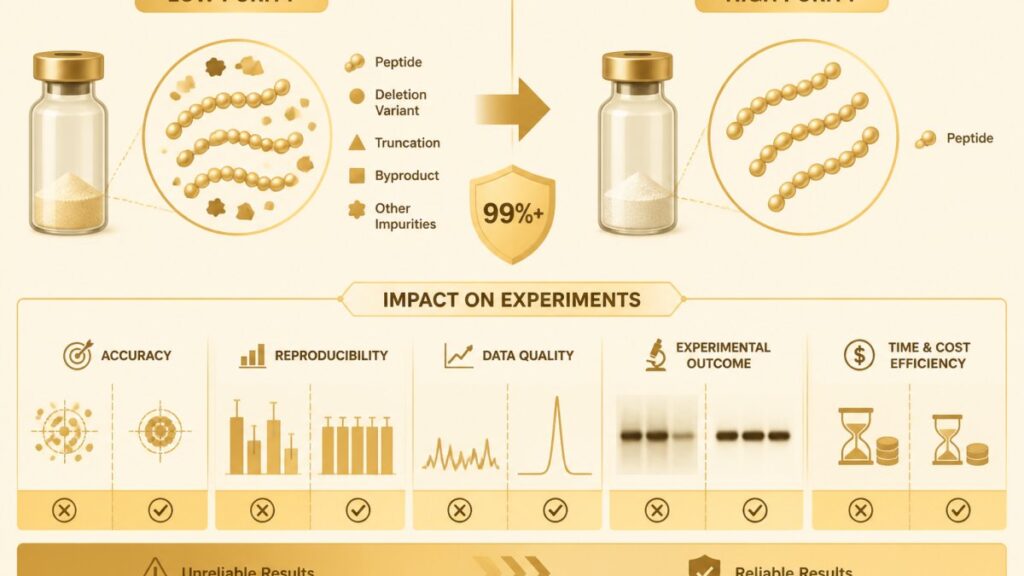
Impure peptides introduce variability. Run the same assay twice with inconsistent purity batches and you get different outcomes, not because your method changed, but because the material did.
In a binding assay, 5% truncated sequences may bind weakly or not at all, so your measured affinity becomes a blend of the true compound’s activity plus noise from inactive fragments. Run the same assay with 99% pure material and the signal clarifies.
Reproducibility depends on consistency. Batch-to-batch purity variability creates noise that masks real effects, forcing researchers to repeat experiments to separate signal from noise, which costs time and money.
A 10% difference in assay results might be real biology or a purity difference between batches. Without knowing each batch’s exact purity, you cannot distinguish between the two.
This is why we emphasize transparent documentation at PepAlphatides. Every batch includes a certificate of analysis that specifies the exact purity percentage measured by independent third-party testing. That transparency lets you account for purity as a variable in your research design.
Lower purity = more experimental noise. Higher purity = clearer signal. Consistent purity across batches = reproducible results you can trust.
How Impurities and Truncated Sequences Influence Biological Activity
Not all impurities affect your experiment equally. Some are chemically inert; others actively interfere with the biological process you’re measuring.
Truncated sequences are particularly problematic in activity assays. A peptide missing even one amino acid often loses its ability to bind targets or trigger cellular responses, so 3% truncated sequences dilute the active compound and make measured activity appear lower than it should be.
Off-target binding occurs when impurities interact with your assay system in ways your target peptide does not, such as binding weakly to a secondary receptor and creating false-positive signals.
Counterions and residual solvents can shift pH, alter osmolarity, or interfere with protein interactions. In cell-based assays, these factors influence cellular response independent of your peptide’s actual activity.
The consequence: your assay results reflect the mixture, not the pure compound. Impurities can mask a therapeutic peptide’s true potency or create noise that obscures real hits in a screen.
This is why acceptable purity levels vary by experiment type, and why peptide purity matters for experiments depends on your readout sensitivity. A binding kinetics study requires higher purity than a simple presence-or-absence screening assay. The more sensitive your biological readout, the more purity matters.
HPLC Peptide Purity: How the Gold Standard Measurement Works
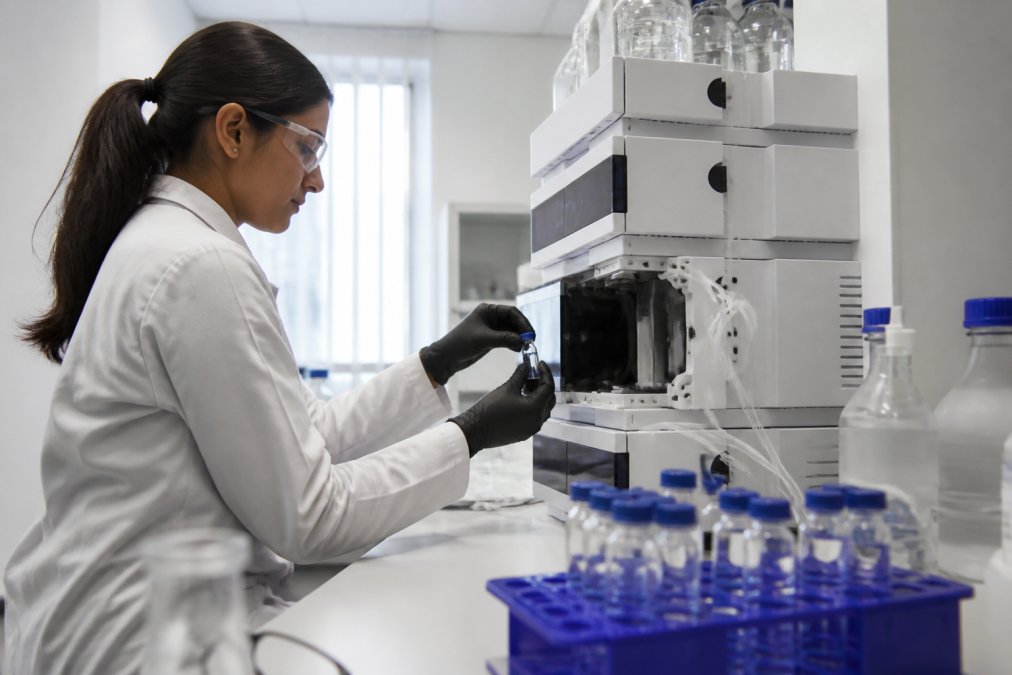
High-performance liquid chromatography (HPLC) is the industry standard for measuring peptide purity. It separates your sample into individual compounds based on chemical properties, then detects and quantifies each one.
Here’s how the process works:
- Sample preparation, Your peptide sample is dissolved in a solvent and injected onto an HPLC column
- Separation, The column contains a stationary phase that interacts differently with each compound in your mixture
- Mobile phase flow, A liquid solvent flows through the column, carrying compounds at different speeds
- Detection, A detector measures the amount of each compound as it exits the column
- Chromatogram generation, The instrument produces a graph showing peaks for each detected compound
The purity percentage is calculated from the peak areas in the chromatogram. If your target peptide produces a peak representing 98% of the total area, your purity is 98%.
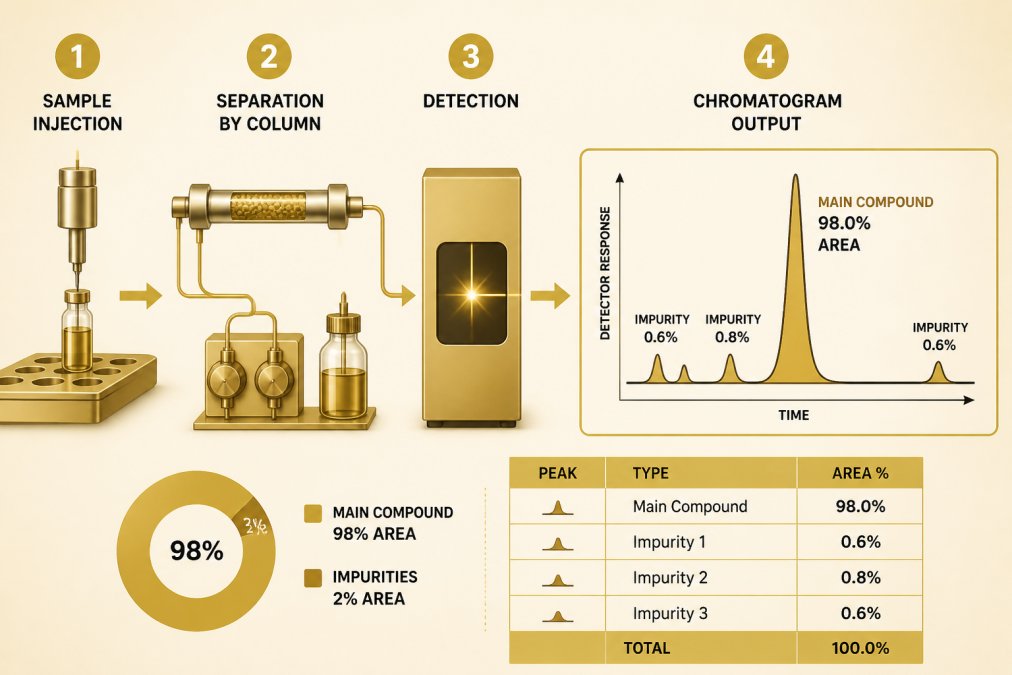
HPLC’s strength is separating similar compounds: two peptides differing by a single amino acid show up as distinct peaks, which is why it became the gold standard for purity analysis.
But HPLC has a limitation: it measures what’s present, not what each compound actually is. A peak in your chromatogram represents something, but HPLC alone cannot confirm its identity. That’s where mass spectrometry comes in.
HPLC purity assumes your detector responds equally to all compounds in the sample. If an impurity has low UV absorbance, it may be present but invisible to the detector, artificially inflating your measured purity. This is why identity confirmation through mass spectrometry matters.
Mass Spectrometry Peptide Identity: Confirming You Have the Right Compound
Mass spectrometry (MS) measures the molecular weight of compounds in your sample, answering a question HPLC cannot: “Is this compound actually what we think it is?”
The instrument ionizes each molecule and measures its mass-to-charge ratio. If the main peak matches your target peptide’s expected molecular weight, the primary compound is confirmed correct.
Mass spectrometry also reveals truncated sequences. A peptide missing two amino acids will have a measurable lower molecular weight. The mass spectrum shows distinct peaks for both the full-length peptide and the truncated version, allowing you to quantify each.
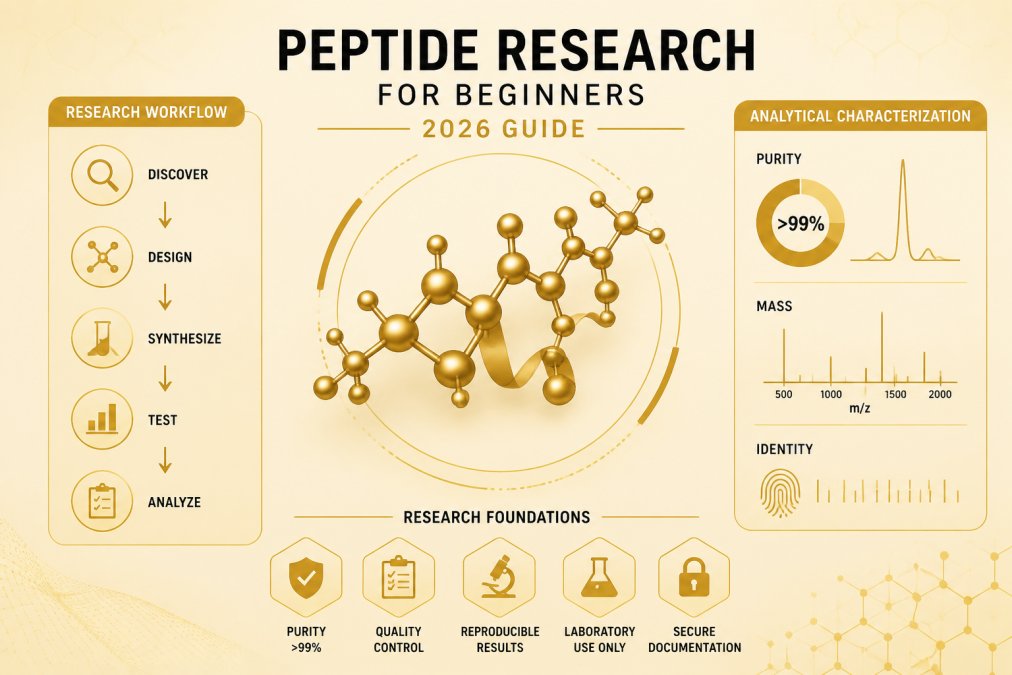
The combination of HPLC and mass spectrometry gives you complete information:
- HPLC tells you: What percentage of your sample is each peak?
- Mass spectrometry tells you: What is each peak actually made of?
Together, they confirm both purity and identity. You know not only that your sample is 98% pure, but also that the 98% is your intended peptide, not a different compound with similar retention time.
At PepAlphatides, every batch undergoes independent third-party testing using both HPLC and mass spectrometry. This dual verification ensures you receive exactly what you ordered, not just a high purity percentage, but confirmation that the pure compound is the correct one.
How to Read a Peptide COA and What the Numbers Tell You
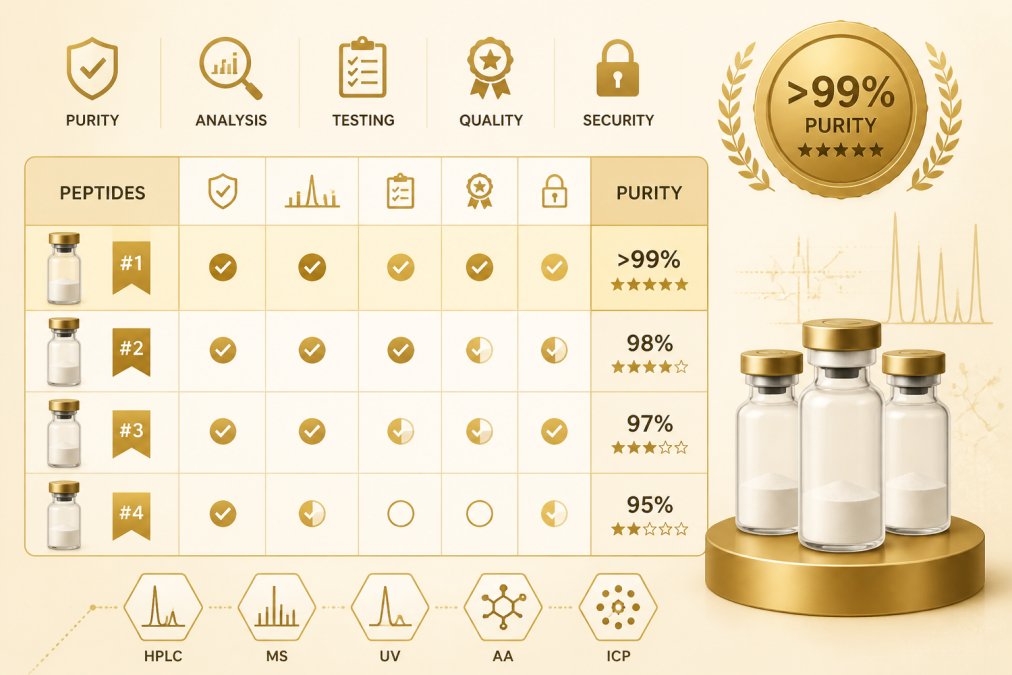
A certificate of analysis records what was measured, how, and with what result. Reading it well means understanding how the headline purity number was produced, since the same sample can yield different reported purities under different analytical conditions.
The fields that matter, and what each one proves
- Batch/lot number and test date: Ties the document to your specific vial. Verify it matches the label before trusting anything else.
- Purity by HPLC (area %): The percentage of total integrated peak area attributed to the main peak. It is a relative measure, not an absolute mass fraction.
- Retention time and method parameters: Column type, mobile phase, gradient, and detection wavelength. These determine what the chromatogram can and cannot resolve.
- Mass spectrometry result: Observed mass versus expected mass, usually with a tolerance. This is the identity check that HPLC cannot provide.
- Concentration or fill amount: Separate from purity. A 99% pure vial can still be underfilled or under-concentrated.
- Appearance and solubility: Quick sanity checks that sometimes flag handling problems.
- Storage and stability guidance: Conditions under which the reported values are expected to hold.
How purity is calculated from a chromatogram
Purity by area percentage is computed by integrating every peak and dividing the main peak’s area by the total:
Purity (%) = (area of main peak ÷ sum of all integrated peak areas) × 100
If the main peak integrates to 980 area units and impurities sum to 20, reported purity is 98.0%. Change the integration baseline and the number moves, which is why method parameters matter as much as the result.
What the number does not tell you
- It does not confirm identity. A co-eluting compound with a similar retention time can inflate the main peak. Only mass spectrometry (or another structural method) confirms the sequence.
- It does not measure concentration. Area percentage says nothing about how much peptide is in the vial.
- It does not prove biological activity. A pure, correctly identified peptide can still be inactive if it degraded or was modified.
- It is not directly comparable across suppliers unless the methods match. Different wavelengths, gradients, and integration settings produce different numbers for the same material.
Method limitations to watch for
- Detection wavelength: UV detection at a fixed wavelength responds differently across compounds. An impurity with weak absorbance at that wavelength can be undercounted, inflating reported purity.
- Co-elution: Two compounds that leave the column at the same time appear as one peak. The reported purity looks better than the material actually is.
- Sample preparation and loading: Overloaded columns and poorly prepared samples distort peak shape and integration.
- Integration choices: Where the baseline is drawn and how small peaks are thresholded are judgment calls that affect the final percentage.
A high area percentage is a statement about peak area under one set of conditions, not a guarantee of identity, concentration, or activity. Treat it as one line of evidence, not the whole story.
A quick COA review checklist
- Does the batch number match the vial?
- Are the HPLC method parameters stated, and is the chromatogram included?
- Does the mass spectrometry result match the expected mass within the stated tolerance?
- Is concentration reported separately from purity?
- Are storage conditions and test date consistent with when you will use the material?
If any of these are missing, ask the supplier before you run the experiment. A complete COA lets you account for purity as a known variable; an incomplete one leaves you guessing.
File each COA by batch number. If results later look anomalous, the COA is your record of what was verified at the time of purchase and under what method.
Acceptable Peptide Purity for Research: What Level Do You Actually Need?
There is no universal acceptable purity. The right level is the lowest purity that keeps impurity-driven variability below the effect size your experiment is trying to detect, a decision you reason through rather than look up.
A practical decision framework
Work through four questions before you choose a grade:
- How large is the effect you are measuring? A dose-response curve resolving a 20% shift in EC50 tolerates more impurity than an assay trying to detect a 5% change.
- How sensitive is the readout to off-target interference? Cell-based and receptor-binding readouts amplify impurity effects; colorimetric presence/absence screens usually do not.
- How many replicates and batches will you use? More replication averages out random impurity noise but does not fix systematic bias from a consistently present impurity.
- Will the data be compared across batches, sites, or time? Cross-batch comparison demands tight, documented purity consistency more than a high headline number.
Mapping common experiment types to purity considerations
These are starting points, not rules. Confirm requirements against your specific protocol and any institutional or funding-body expectations.
- Presence/absence or preliminary screening: Moderate purity is often adequate because you are ranking activity, not quantifying it. The main risk is a false positive from an impurity with its own activity.
- Binding assays (Kd, IC50, competition): Impurities that bind weakly or not at all dilute the active fraction and bias affinity estimates. Practitioners typically want high purity plus verified identity here, because the fit assumes a single active species.
- Cell-based and signaling studies: Residual solvents, counterions, and truncated fragments can shift viability, pH, or osmolarity independently of your peptide. Higher purity reduces confounders that are hard to control for after the fact.
- Antibody production and immunization: The immune system responds to dominant epitopes, so minor impurities are usually tolerated, but a large truncated fraction can divert the response toward the wrong sequence.
- Analytical method development and reference standards: This is where the highest purity is most justified, because the material itself becomes the benchmark against which other samples are judged.
The cost-versus-quality trade-off
Additional purification raises cost, and the marginal gain shrinks as purity climbs. If your readout cannot resolve the difference between two grades, the higher grade buys documentation, not better data. If your readout is sensitive and conclusions depend on small effect sizes, the higher grade is usually cheaper once you count repeated failed runs.
A worked comparison
Suppose two batches of the same peptide arrive at 96% and 99% purity by HPLC. In a screening assay with triplicate wells, the 96% batch may produce usable rankings. In a competition binding assay where you are fitting a curve to estimate affinity, the 3% impurity fraction can flatten the curve and shift the apparent Kd. Same peptide, same supplier, different decision, because the experiment’s tolerance for a mixed signal differs.
Choose purity by asking what your readout can resolve, not by defaulting to the highest number. Document the grade you chose and why, so a future reviewer can see that purity was a controlled variable rather than an afterthought.
When in doubt, run a small pilot at two purity grades and compare your actual readout. Empirical tolerance beats a guessed threshold.
Purity Versus Identity, Concentration, and Biological Activity
These four measurements are related but distinct. Confusing them creates serious experimental problems.
Purity answers: “What percentage of my sample is the intended compound?” It’s a ratio, measured by HPLC.
Identity answers: “Is this compound actually my target peptide?” It’s confirmed by mass spectrometry or other structural analysis.
Concentration answers: “How many micrograms or micromoles are in my vial?” It’s measured by various methods (UV absorbance, amino acid analysis, mass balance).
Biological activity answers: “Does this peptide actually do what I expect in my assay?” It’s measured by your experimental readout, not by analytical chemistry.
You could have a sample that is:
- 99% pure (high purity) but contains the wrong peptide (failed identity)
- 99% pure and correct identity, but at half the stated concentration
- 99% pure, correct identity, correct concentration, but biologically inactive due to degradation or modification
Each scenario requires different troubleshooting. If your assay results don’t match expectations, you need to know which of these four factors failed.
This is why PepAlphatides provides independent third-party testing that covers both purity (HPLC) and identity (mass spectrometry). Purity alone is incomplete information. You need confirmation that the pure compound is actually your target peptide.
When you design an experiment, specify what you need for all four:
- “I need 98% purity by HPLC”
- “I need mass spectrometry confirmation of identity”
- “I need concentration verified to within 5%”
- “I need to validate biological activity in my specific assay”
This clarity prevents surprises when your results arrive.
Batch-to-Batch Consistency and Reproducibility in Your Research
Reproducibility depends on consistency. If peptide purity varies between batches, your results will vary even if your method stays identical.
Run a binding assay with batch A (99.2% pure) and measure a Kd of 2.5 nM. Three months later, repeat it with batch B (98.1% pure) and measure 3.1 nM. Is that real biology or just lower purity in batch B?
Without batch-to-batch consistency, you cannot answer that question confidently.
Reliable suppliers maintain tight purity control across batches. This means:
- Using standardized synthesis protocols
- Implementing rigorous purification procedures
- Testing every batch independently
- Documenting results transparently
When you work with a supplier that provides a certificate of analysis for every single batch, not just a representative sample, you gain the ability to account for purity as a known variable in your research.
Batch variability also matters when combining data across experiments or collaborators: if a collaborator uses a different batch with different purity, your combined dataset becomes harder to interpret.
This is why we emphasize batch transparency at PepAlphatides. Every vial includes a secure QR code linking to that specific batch’s certificate of analysis. You know exactly what purity you received, and you can compare it to other batches you’ve used. This transparency makes it possible to account for purity differences when interpreting your data.
When you order research-grade peptides, purity is your first quality indicator, but it’s not the only one that matters. Understanding what purity means, how it’s measured, and what it can and cannot tell you is essential for designing experiments that produce reliable, reproducible results.
The compounds you work with directly influence the conclusions you draw. High-purity peptides with verified identity and transparent documentation let you focus on the biology instead of troubleshooting material quality. At PepAlphatides, we’ve built our reputation on providing exactly that: peptides exceeding 99% purity, backed by independent third-party testing and secure batch documentation. When your research depends on material consistency, our commitment to transparency and quality gives you the foundation for confident experimental work. Explore our research-grade peptide catalog and see how batch-verified purity can improve your experimental reliability.
Frequently Asked Questions
Is 98% purity good for a peptide?
98% purity is acceptable for many research applications, but it depends on your experiment type. For binding assays and cell-based studies, 95-99% purity typically works well. For more sensitive assays or when off-target binding could confound results, 99%+ purity reduces variability. The remaining 2% could be truncated sequences, deletion sequences, or residual solvents, each affects biological activity differently. Check your assay’s sensitivity requirements and consider running controls with your specific purity level to validate results.
How can peptide impurities affect experimental results?
Impurities introduce uncontrolled variables into your experiment. Truncated sequences and deletion sequences may have reduced or altered biological activity compared to the correct active compound, skewing dose-response curves. Side products and counterions can cause off-target binding, masking true effects or creating false positives. Residual solvents can interfere with assay chemistry. Batch-to-batch variability in impurity profiles makes it harder to reproduce results, especially across multiple experiments or labs. High-purity peptides reduce these confounding factors, improving data reliability.
What does the purity percentage on a Certificate of Analysis actually tell me?
The purity percentage (measured by HPLC) tells you what fraction of your sample is the correct active compound. A 99% purity rating means the HPLC chromatogram shows 99% peak area for your target peptide and 1% for all other compounds combined. However, purity alone does not confirm identity, you need mass spectrometry for molecular mass verification. Purity also does not directly measure concentration or biological activity. It tells you about chemical composition, not whether the peptide will work in your specific assay. Always pair purity data with identity confirmation and concentration measurements.
How do I verify peptide purity from a certificate of analysis?
Look for three key elements on the COA: (1) HPLC chromatogram showing peak area percentages, your target peptide should be the dominant peak; (2) mass spectrometry data confirming the molecular mass matches your expected peptide sequence; (3) purity statement as a percentage, typically 95-99%+. Cross-check the batch number on the COA with your vial label. Verify the testing was done by an independent third-party lab, not the supplier alone. If the COA lacks chromatogram details or mass spectrometry confirmation, request the full analytical report before use.